
 brothy
Graph view
ctrl+g: the notes the open note links to and from, out to two links, as a picture beside a list.
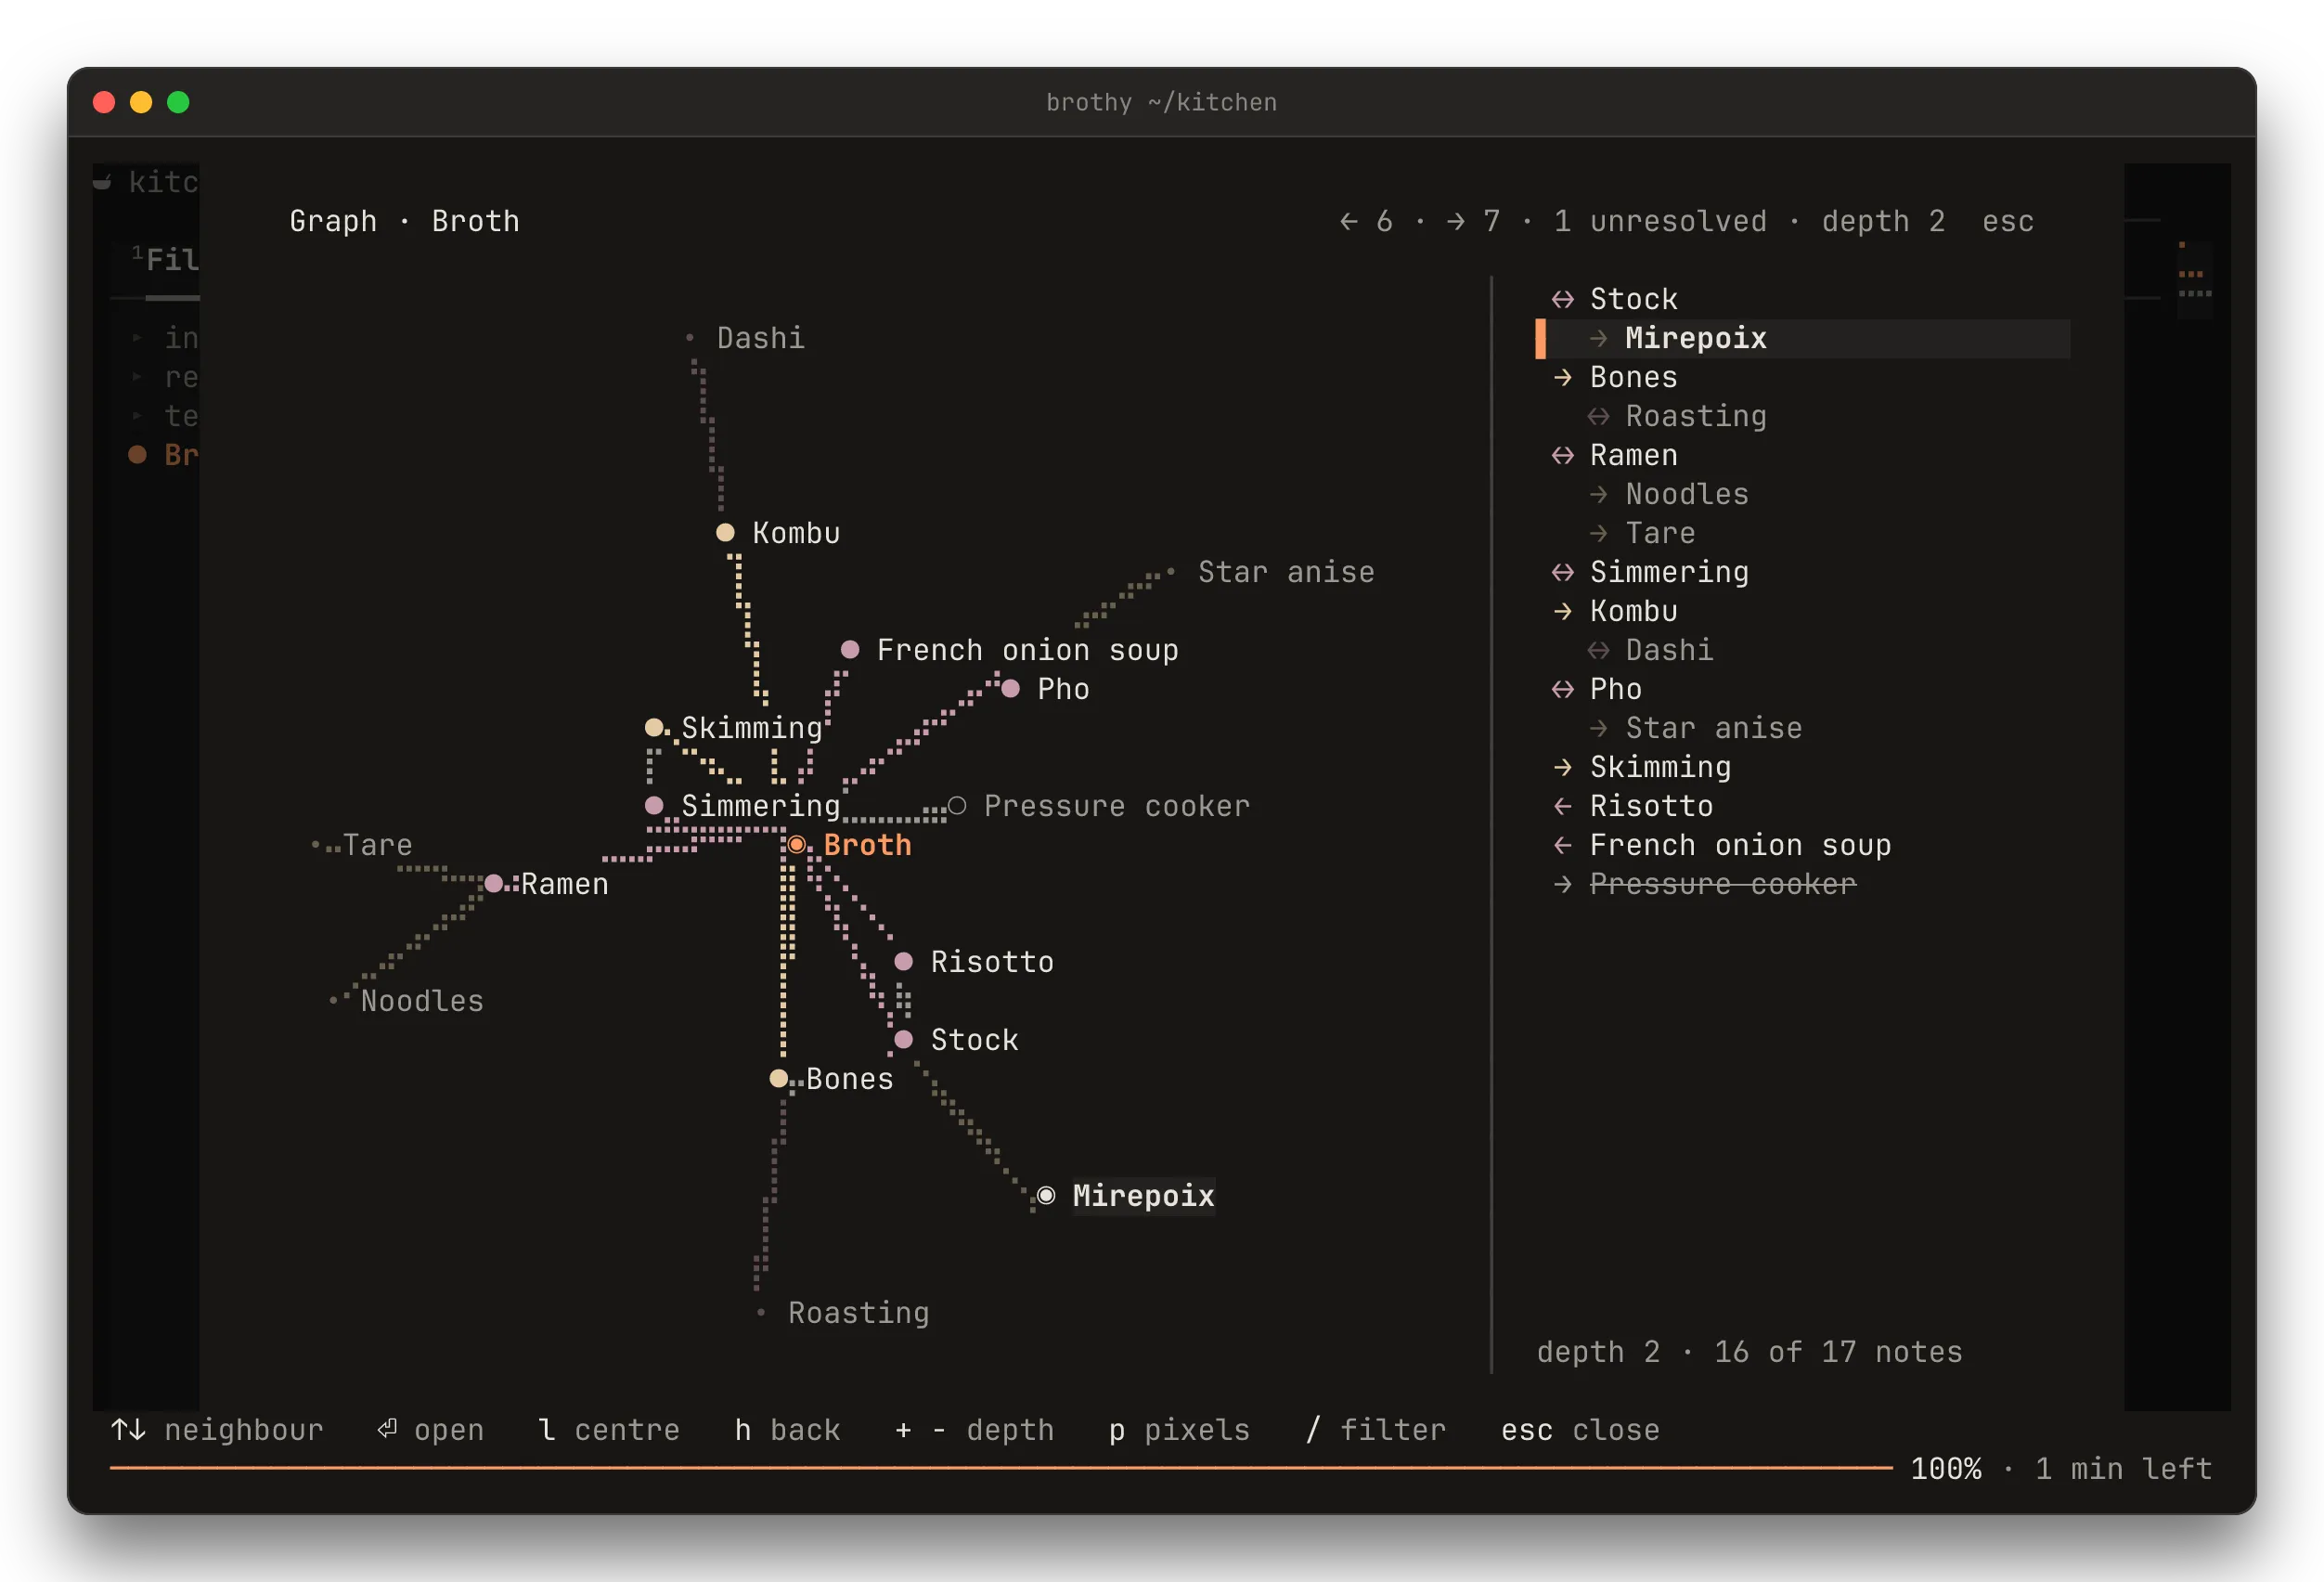
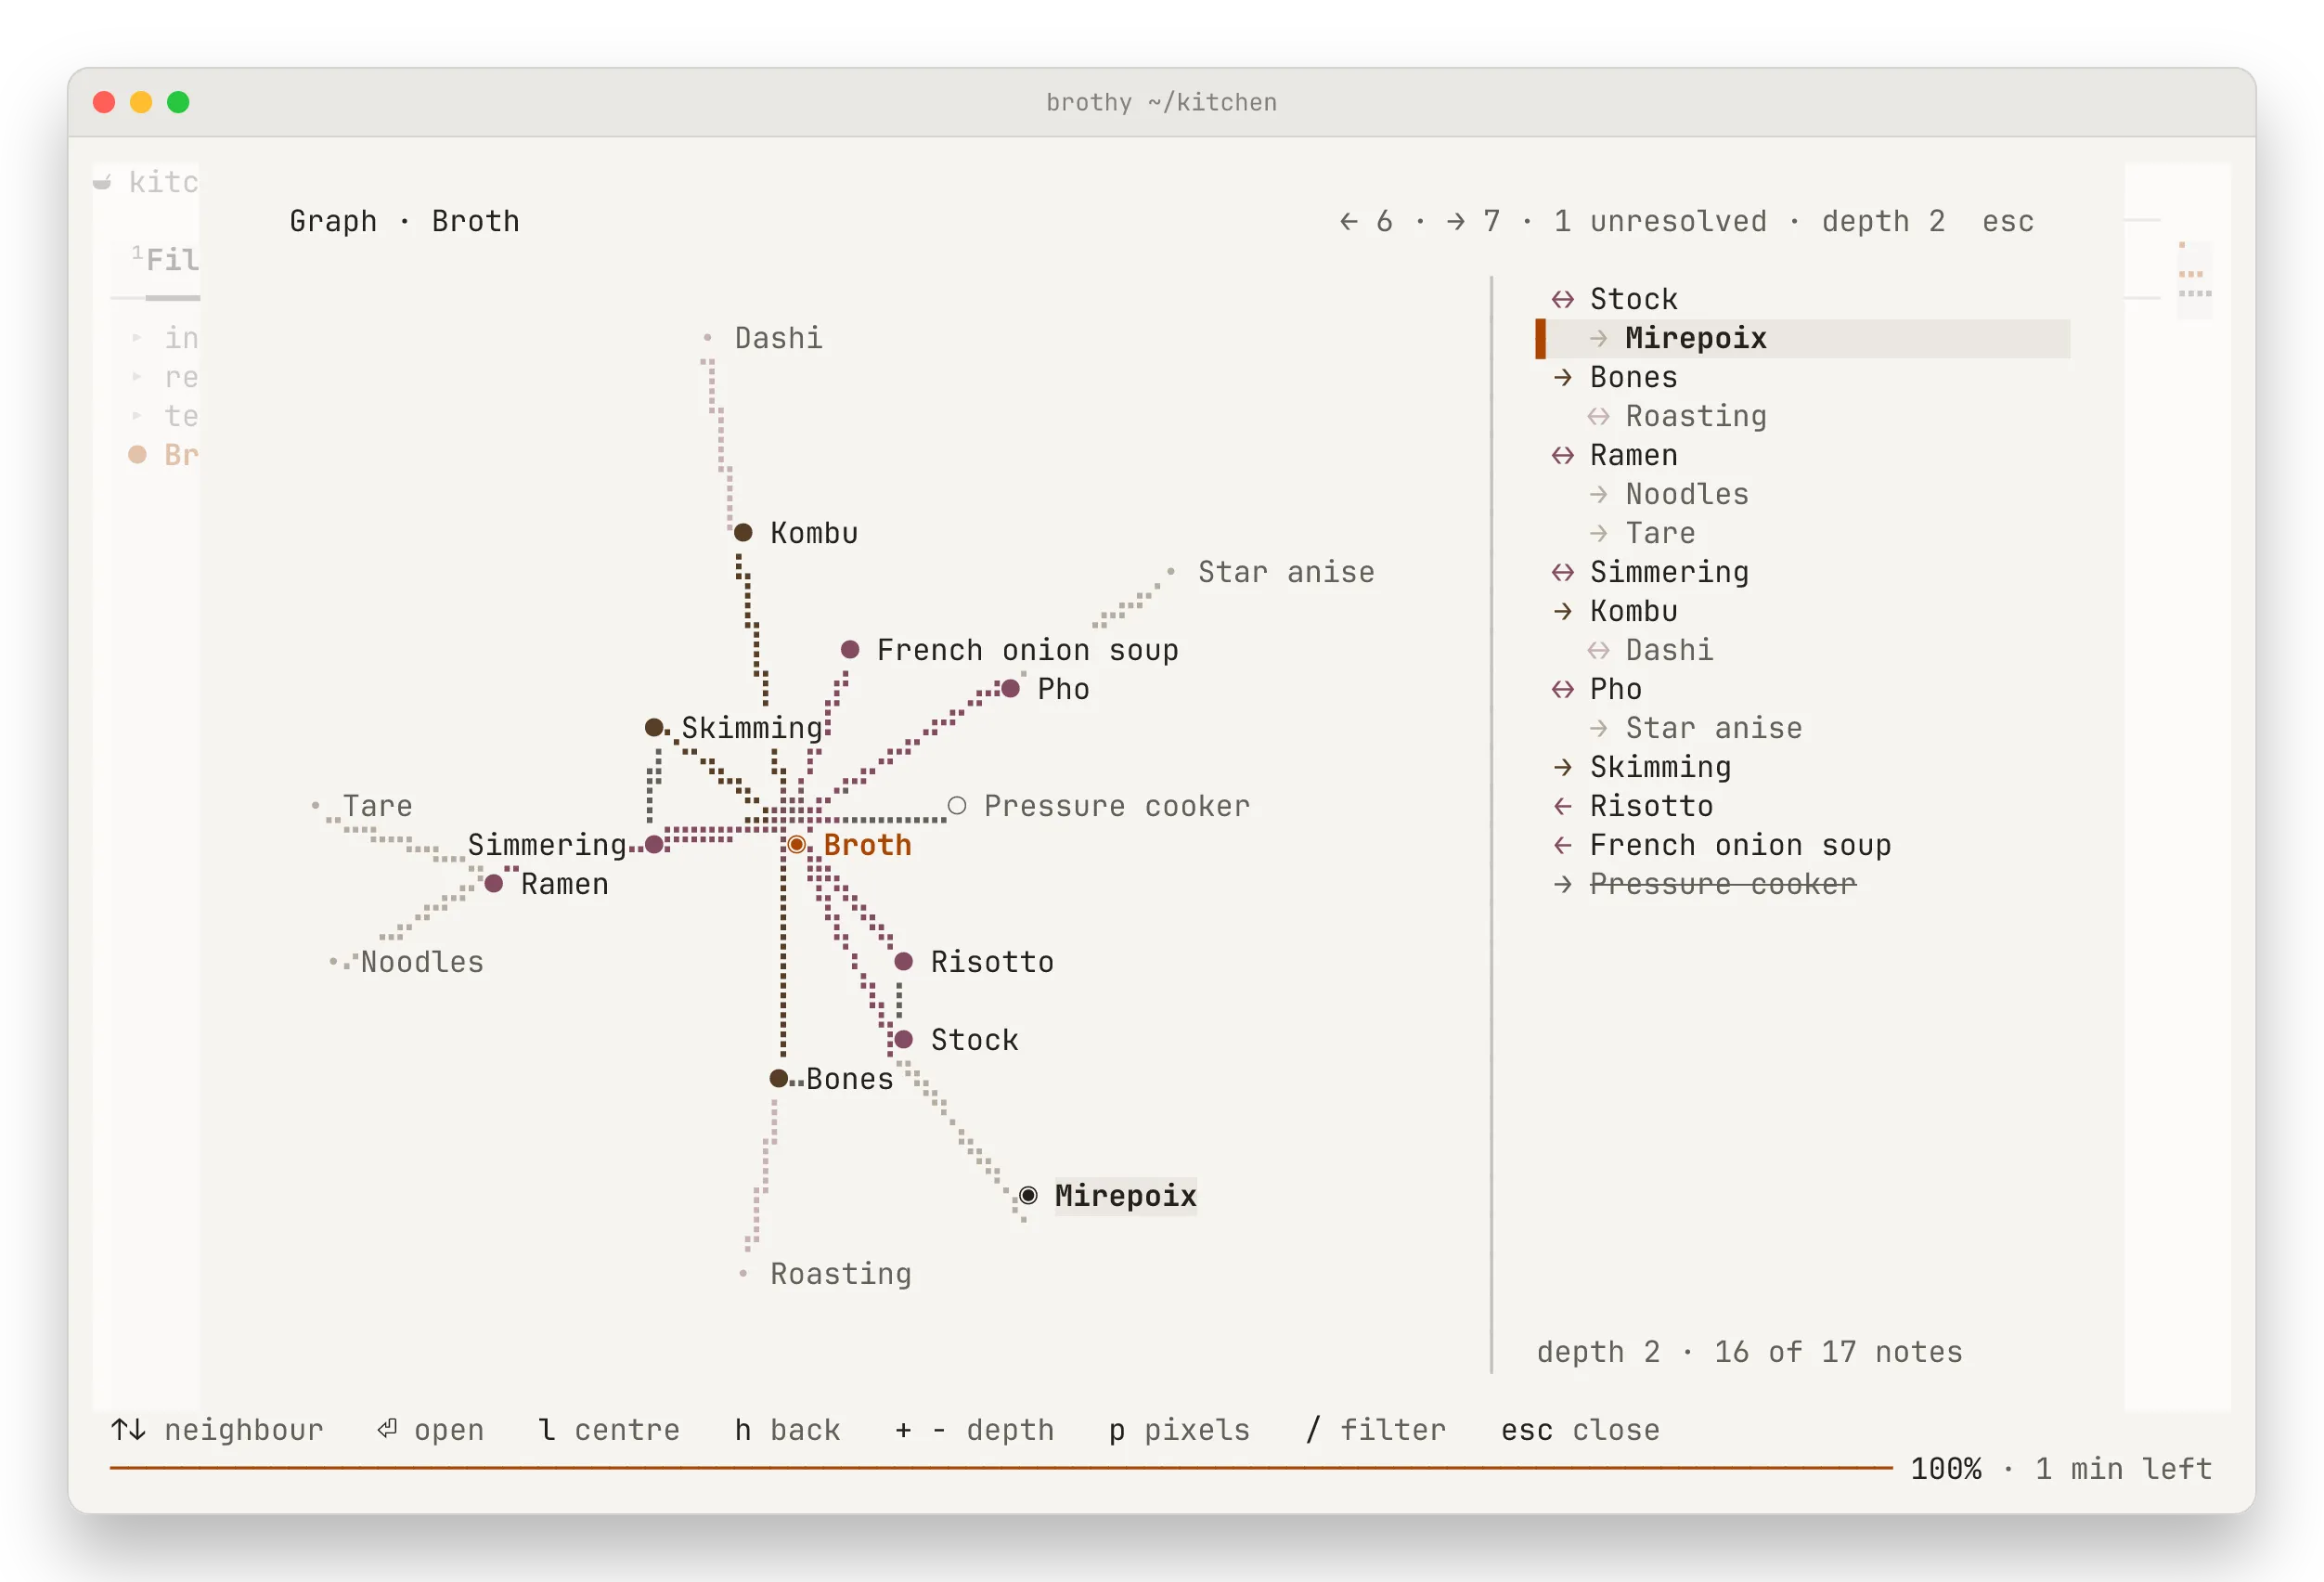
ctrl+g opens Graph: the open note in the middle, the notes it links to and the notes that link to it around it, and the notes one more link away further out. The title says how many: ← 9 · → 6 · 2 unresolved · depth 2.
Reading it
Section titled “Reading it”The centre is the largest node, in the theme’s primary colour. Notes it links to (→) are in the secondary colour, notes that link to it (←) in the accent colour, and a note linked both ways (↔) is an accent node with a ring. Notes two links away are dimmer, and so are their labels; a name that has no room is left off the picture but stays in the list. A link to a note that doesn’t exist shows as a hollow, muted node, struck through in the list.
From 100 columns the list sits to the right: each linked note, with the notes it brings in indented under it. Below that width the picture takes the whole popup and the row under it names the focused note. With more than 18 links, the best connected are drawn and + 12 more · ⏎ all lists the rest.
| Key | Action |
|---|---|
| ↑ ↓ j k tab | move through the linked notes |
| ⏎ | open the focused note (on + n more: list them all) |
| l → | centre on the focused note; the sheet stays |
| h ← | back to the note you centred from |
| + - | depth 2 or 1 (saved) |
| p | pixels or braille (saved) |
| / | filter the list; notes that don’t match dim in the picture |
| H L | close, then back or forward through your notes |
| esc | clear the filter, else close |
The mouse works too: hover moves the focus, a click on a note centres on it, and a double-click opens it, as does a click on the note you moved to with the keys.
Pixels or braille
Section titled “Pixels or braille”In a terminal with the kitty graphics protocol (kitty, Ghostty, WezTerm, iTerm2, Konsole) or sixel (foot, Windows Terminal) the picture is drawn in pixels. Everywhere else, and inside tmux, it is drawn in braille, like the minimap. The names are always text in your font. p switches between the two and saves the choice as graph.render in config.json. Where pixels cannot show, p says graph · pixels unavailable here · braille and saves nothing.
A multiplexer can say it shows images when the screen you look at can’t: herdr does over mosh, for example. When that happens the first open says graph · pixels · p braille; press p once.
Limits
Section titled “Limits”The graph shows the open note’s neighbourhood, not the whole vault, and links are wikilinks ([[note]]). It waits for the note index the first time (▍ indexing notes), as ctrl+p does. Zen has no graph.